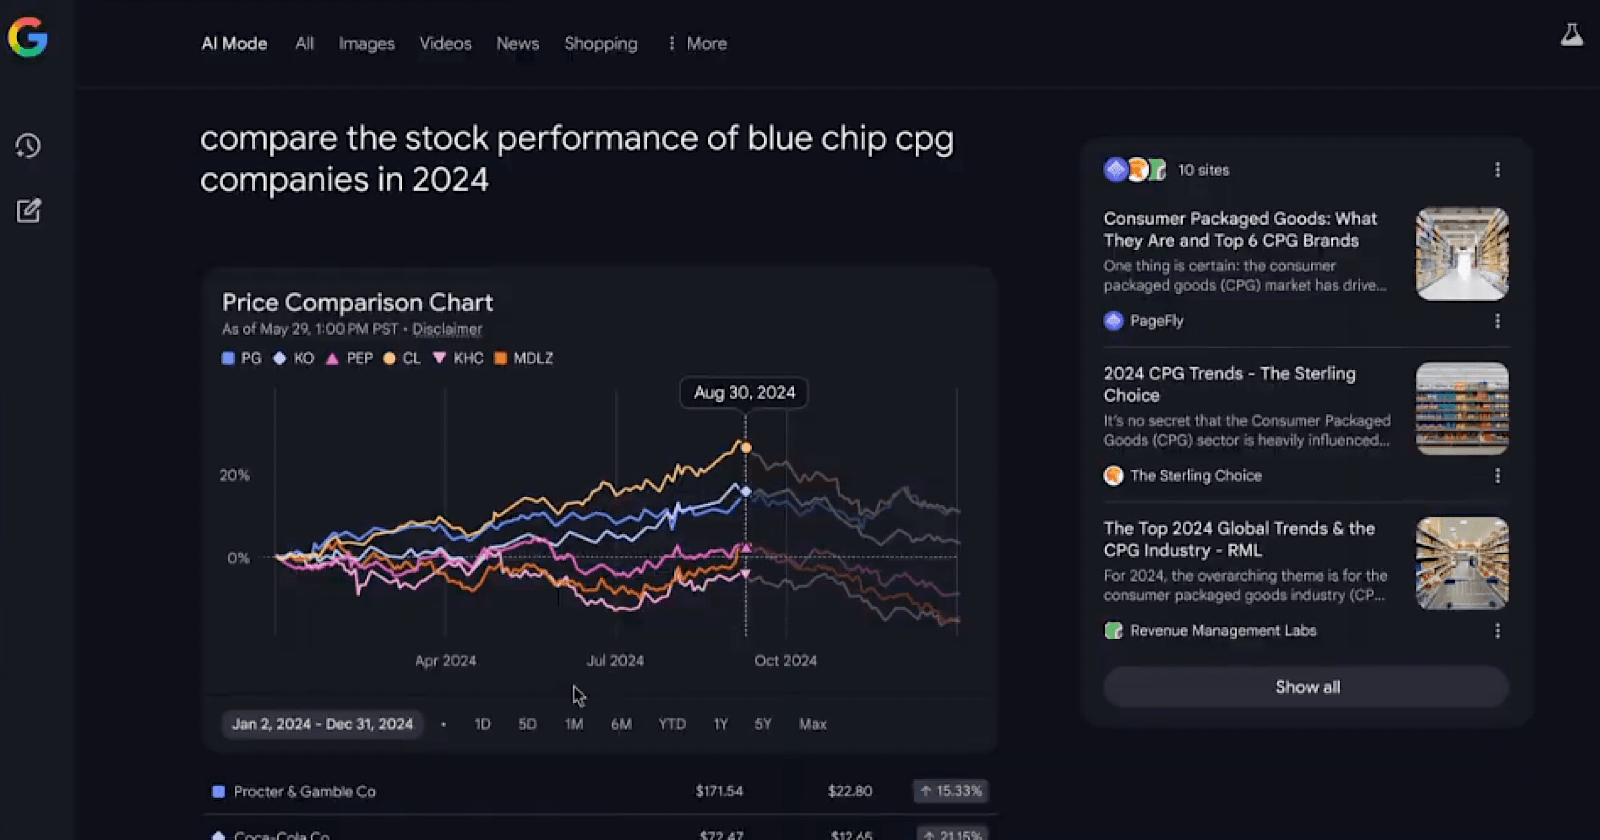
Google Unveils Interactive AI-Powered Financial Visualizations
Google has started rolling out interactive graphics in its AI mode through laboratories, allowing users to engage with complex financial inquiries easily. This new feature enables individuals to receive visual representations and detailed explanations tailored specifically to their questions.
Revolutionizing Financial Analysis with Visual Analytics
According to Soufi Esmaeilzadeh, Director of Product Management for Research at Google, users can pose inquiries such as “compare the stock performance of Blue Chip CPG companies in 2024” and receive automated insights complemented by visual graphics. This marks a significant advancement in how financial data is presented and understood.
Automated Research at Your Fingertips
With Google’s AI-enabled system, research is conducted automatically. Users can get a detailed analysis of individual companies and their stock metrics without the need for manual effort. This capability is especially beneficial for investors and analysts looking for quick and reliable financial comparisons.
Intelligent Follow-Up Queries in AI Mode
The AI is designed to respond to follow-up questions seamlessly. For instance, if a user inquires, “Have any of these companies paid dividends?” AI mode comprehends the context, delivering relevant information quickly. This interactive experience fosters a more engaging and efficient research process for users.
Advanced Technology Behind the Scenes
Google leverages the advanced reasoning and multimodal capabilities of its Gemini system to empower this functionality. The technology meticulously analyzes user inquiries, pulling both current and historical financial data to present the information in the most effective manner. This ensures that users receive accurate and comprehensive data interpretations.
Implications for Financial Publishers
The emergence of direct visual answers to complex financial questions poses challenges for traditional financial websites that thrive on comparative content. Researchers may find themselves relying less on external sites for basic comparison data. However, this development also opens doors for publishers to enhance their offerings with in-depth analysis or expert commentary, carving out new avenues for value addition.
Accessing the New Data Visualization Function
The data visualization feature is presently accessible through Google’s AI mode in its labs, indicating that it is still in the experimental stage. Google has yet to announce plans for wider deployment or expansion to additional data types beyond finance. Interested users can join the Google Laboratory program to experience this innovative functionality firsthand.
Looking Forward: The Future of AI-Driven Research
The trend towards comprehensive visual responses aligns with Google’s strategy to position itself as an essential information source rather than merely a portal to other websites. While the current implementation focuses on financial data, the potential exists for this technology to extend into other data-heavy industries. As this experimental functionality evolves, it could redefine how users interact with research powered by AI.